
[Smart City Today]
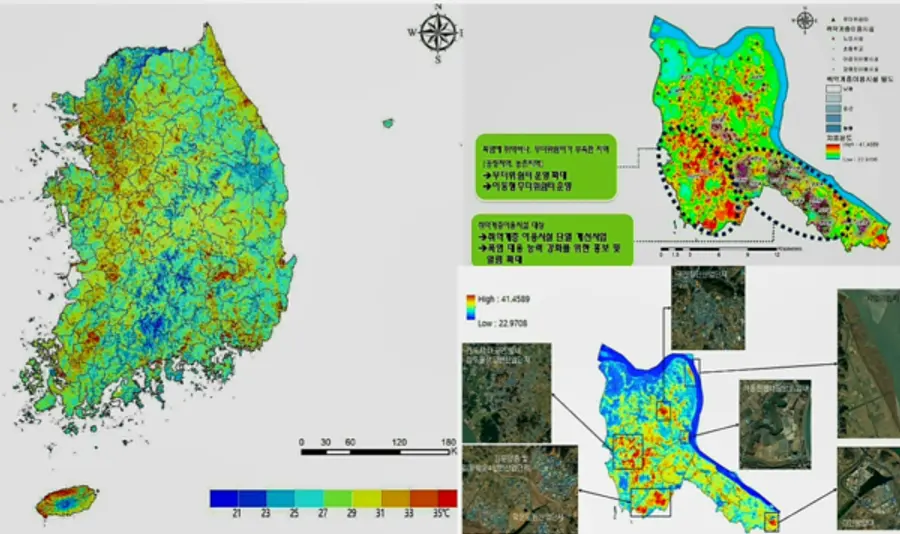
The National Institute of Environmental Research, affiliated with the Ministry of Environment, provides a "National Ground Surface Temperature Map" through the National Environmental Zoning Map service so that local governments can grasp the actual status of heat distribution in the region and prepare measures to reduce damage caused by the heat wave.
The temperature data of the observatory is usually from measuring inside the instrument shelter, which is set on the lawn and is away from the ground and shaded.
On the other hand, the ground surface temperature is measured right on the surface, reflecting the radiation temperature due to the amount of insolation coming from the sun and the radiation temperature emitted from the surface.
The ground surface temperature map released this time shows the surface temperature of forests, urban areas, and agricultural lands constituting the surface in color form from ▲ blue (below 21°C) to ▲ red (below 35°C), and consists of a grid with a resolution of 30m.
The ground surface temperature map has been prepared by city and county for all local governments across the country using thermal infrared images re-photographed by the U.S. Landsat 8 satellite every 16 days for the past five years from 2016 to 2020.
It has been gotten by converting the thermally infrared observations of satellite images taken in the summer of June to August from 2016 to 2020, to temperature, and then selecting and combining the highest temperature of five years for each grid.
Previously, ground surface temperature maps using data for three years from 2016 to 2018 were provided, but data for 2019 and 2020 were additionally reflected, reducing errors depending on the satellite shooting date and the weather at that time.
The ground surface temperature is affected by the date of filming, the weather at the time of filming (amount of clouds, etc.), land coverage (forest, urban area, agricultural land, etc.), the ground direction (south, north, etc.), and the temperature of the surrounding grid.
Since the ground surface temperature map is made by photographing a large area at the same time, it is effective in grasping the spatial distribution and difference between regions that emit relatively much heat within the same local government and regions that do not.
Since the ground surface temperature map is produced by a satellite image of a large area at the same time, it is easy to grasp the thermal distribution of a wide area. It is easy to visually recognize the distribution of areas that emit relatively much heat within the same local government and areas that do not.
However, weather observation data show the value around the observation station well, but the value of the area between the observation station and the observation station is unknown, so the value is predicted through the weather prediction model.
The ground surface temperature map shows the local heat distribution that appears within local governments easily and visually without this process. It is expected to help local governments establish measures to adapt to climate change, such as responding to the heat wave and make decisions on where to concentrate limited manpower and budget.
For example, this map makes it easy to see that the surface temperature of urban areas or industrial areas is higher than that of forests or agricultural lands.
In the case of Gimpo-si, it can be seen that the ground surface temperature of the industrial complex is higher than 10°C or higher than that of the surrounding forests or agricultural lands.
The National Institute of Environmental Research said that Gimpo-si used the surface temperature map in its heat wave response plan when establishing an environment conservation plan for 2021-2030.
Kim Dong-jin, head of the National Institute of Environmental Research, said, "The release of the national summer ground surface temperature map will reduce the time and cost spent producing separate maps for each local government to understand the current thermal distribution." And "We expect that it will proactively respond to the heat wave for local residents and help establish environmental plans to adapt to climate changes."


![[토큰경제학] 엔비디아의 다음 돈줄은 GPU가 아니라 메모리다](https://cdn.www.smarttoday.co.kr/w400/q85/article-images/2026-06-10/b8779f99-0e61-4370-ab4d-d84e450ee10e.jpg)

댓글 (0)
댓글 작성
댓글을 작성하려면 로그인이 필요합니다.
로그인하기